Logistic Regression
In statistics, the logistic model (or logit model) is used to model the probability of a certain class or event existing such as pass/fail, win/lose, alive/dead or healthy/sick. This can be extended to model several classes of events such as determining whether an image contains a cat, dog, lion, etc. Each object being detected in the image would be assigned a probability between 0 and 1, with a sum of one.
 After cleaning is done to the datasets, they are both inserted into a PostgreSQL database. From there, we import them into our Model for training.
Unneeded features are dropped from the data sets. Features 'Season' and 'TM' are set as a new dataframe to use later.
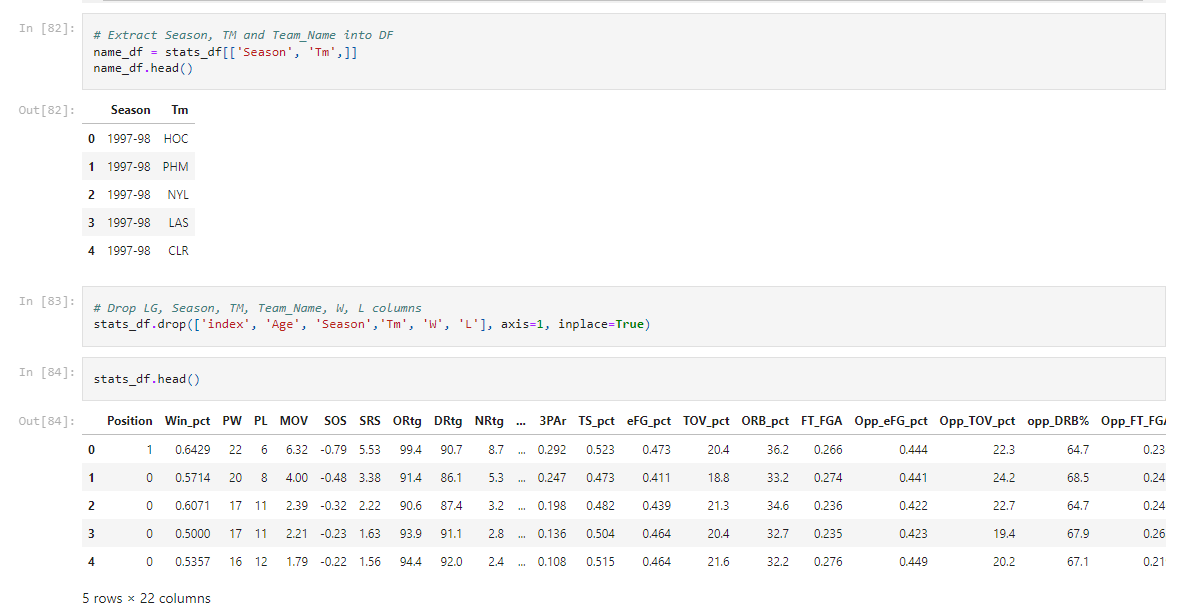
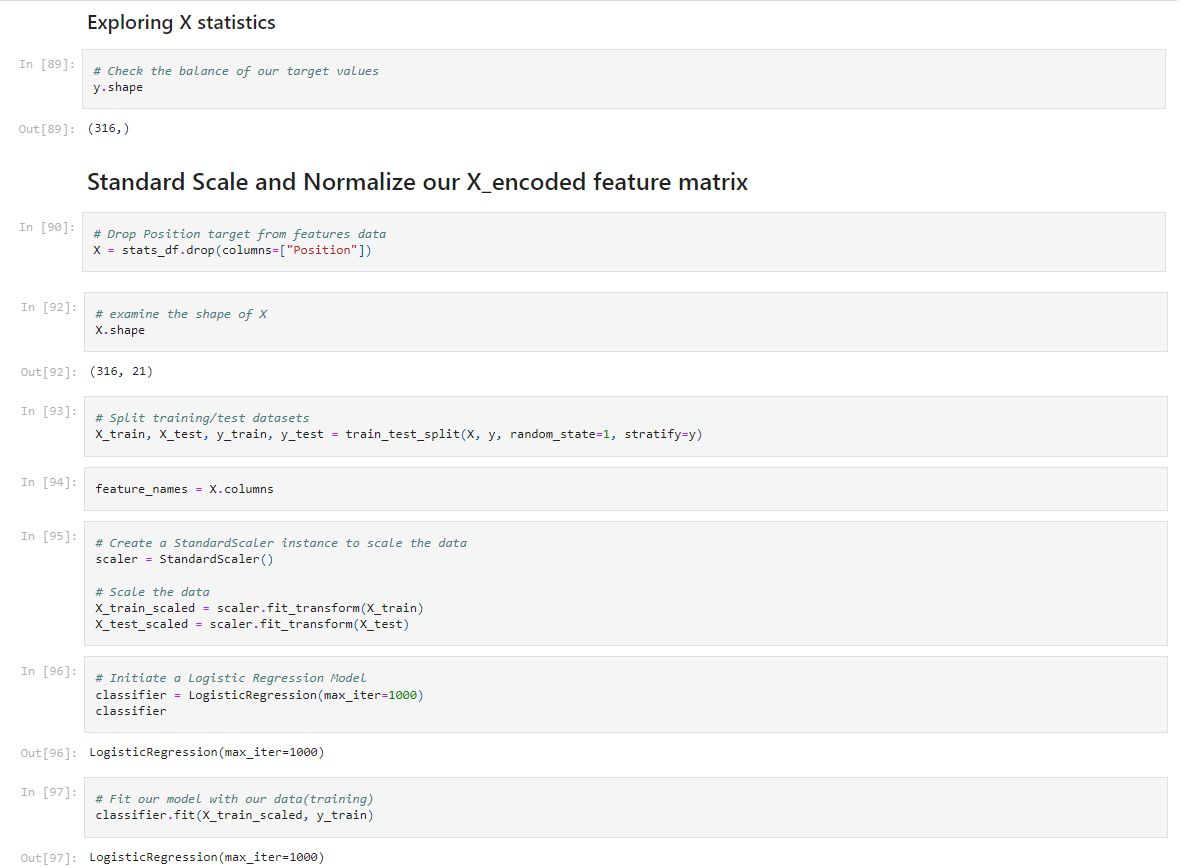
Since we are using 'Position' feature as our Binary target for this model, we assign 'Position' to the y variable. All other features are assigned to variable X. The data is then split into 4 groups. X_train, X_test, y_train, and y_test. These will be used to train and test the models accuracy. X_train and X_test are then scaled to normalize the data. Our model is then created as 'classifier' and the training data is passed through. The model 'learns' which features from the X_train data that are most important in determining the outcome of our y_train feature, 'Position'.
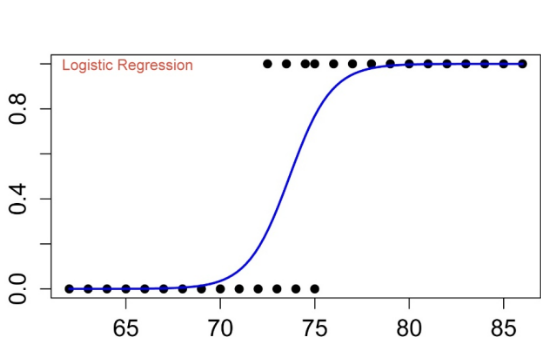
Logistic Regression is similar to linear regression in that the aim is to find the values of the coefficients that weight each feature. But unlike linear regression, the output is transformed using the logistic function, which looks like a big 'S'. Each team is given either a '0' or '1' and plotted of the S curve graph.
We will then score the data by passing the test sets through the model. This shows that by training our model with X_train and y_train, it is 92.41% accurate at choosing which binary outcome of feature 'Position' is determined.

We used multiple methods to find the important features for this model. Ranking features using Coefficients, Recursive Feature Elimination and Select from Model methods were used and explored by removing the bottom features of each and scoring accuracy. It was found that no matter which method we used or which features were removed, accuracy decreased. We chose to use all features to train this model.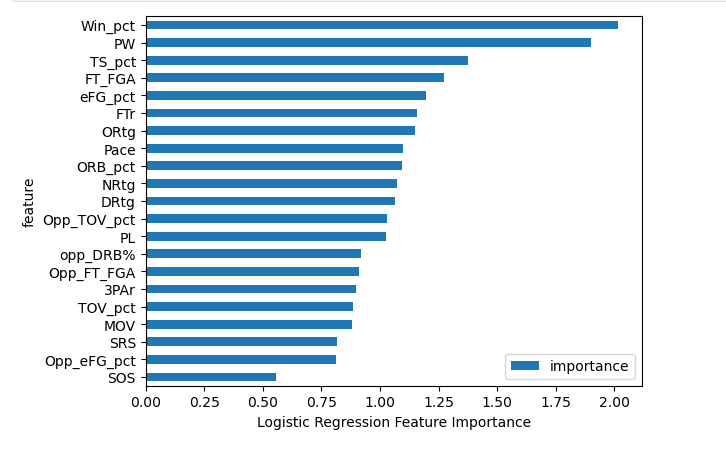 Now time to pass through our current year dataset.

